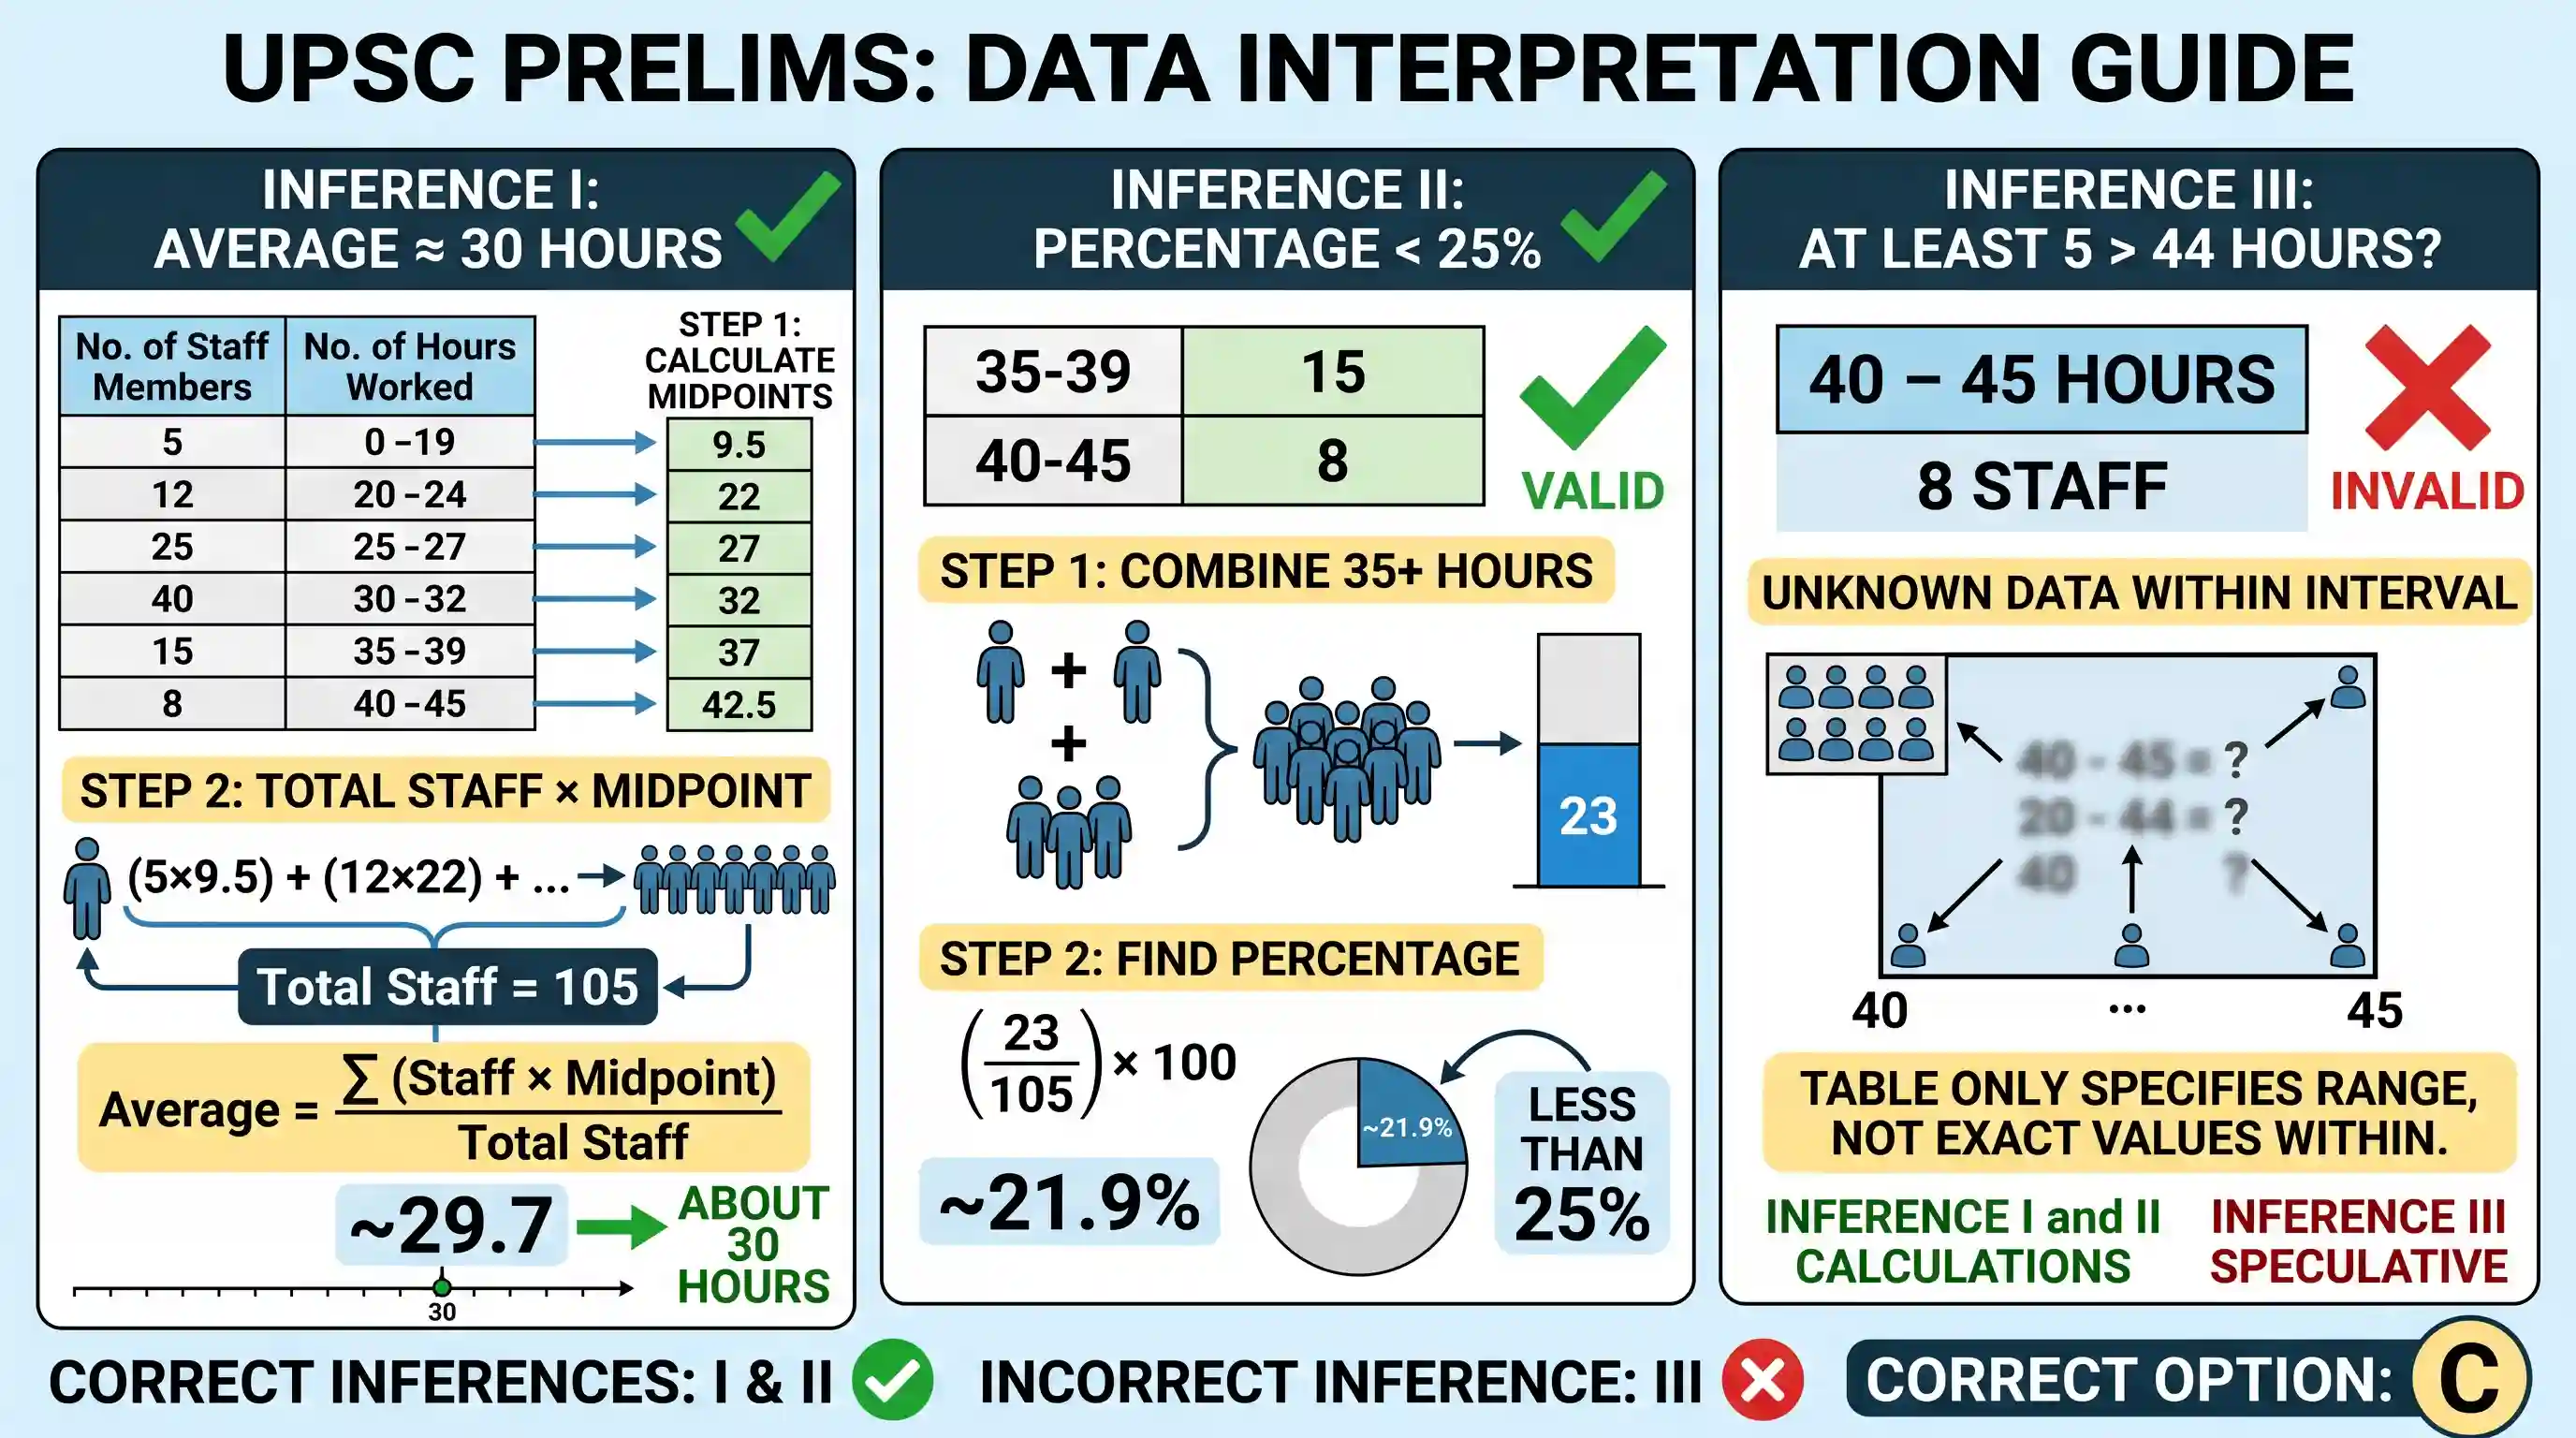
In an office, the distribution of work hours is as shown in the following table: No. of Staff Members No. of hours worked 5 0 - 19 12 20 - 24 25 25 - 29 40 30 - 34 15 35 - 39 8 40 - 45 Consider the following inferences drawn from the table: I. The average number of hours worked by a staff member is about 30. II. The percentage of those who worked 35 or more hours is less than 25. III. At least 5 staff members worked more than 44 hours. Which of these inferences is/are valid?
- AI alone
- BII alone
- CI and IICorrect
- DI, II and III
Explanation
To determine the validity of the inferences, we first calculate the total number of staff members by adding the frequencies: 5 + 12 + 25 + 40 + 15 + 8 = 105.
Inference I is valid. To find the average, we use the midpoints of the classes: 9.5, 22, 27, 32, 37, and 42.5. Multiplying these by their respective number of staff and dividing by 105 gives an average of approximately 29.7, which is about 30.
Inference II is valid. The number of staff members who worked 35 or more hours is 15 + 8 = 23. To find the percentage, we calculate (23 divided by 105) multiplied by 100, which is approximately 21.9 percent. This is indeed less than 25 percent.
Inference III is invalid. The last class interval is 40 to 45, containing 8 staff members. While it is possible that 5 or more worked more than 44 hours, the table does not provide specific data within the interval to guarantee this. We only know that 8 people worked somewhere between 40 and 45 hours.
Since only I and II are valid, the correct option is C.
Related questions
More UPSC Prelims practice from the same subject and topic.
- Prelims 1999GS1science-and-technology
In eye donation, which one of the following parts of donor’s eye is utilised?
- Prelims 1999GS1science-and-technology
Consider the following statement: An ordinary light bulb has a rather short life because the I. filament wire is not uniform. II. bulb cannot be evacuated completely. III. wires supporting the filamen…
- Prelims 1999GS1science-and-technology
Match the hormones in List I with items in List II and select the correct answer using the codes given below the Lists: List I I. Adrenaline II. Estrogen III. Insulin IV. Pheromones List II A) Anger, …
- Prelims 1999GS1science-and-technology
Match List I (Drugs / Chemicals) with List II (Their uses) and select the correct answer using the codes given below the Lists: List I I. Atropine II. Ether III. Nitro-glycerine IV. Pyrethrin List II …
- Prelims 1999GS1science-and-technology
Match List I (Quantity) with List II (Units) and select the correct answer using the codes given below the Lists: List I List II I. High speed A) Mach II. Wavelength B) Angstrom III. Pressure C) Pasca…
- Prelims 1999GS1science-and-technology
For which one of the following is capillarity not the only reason?