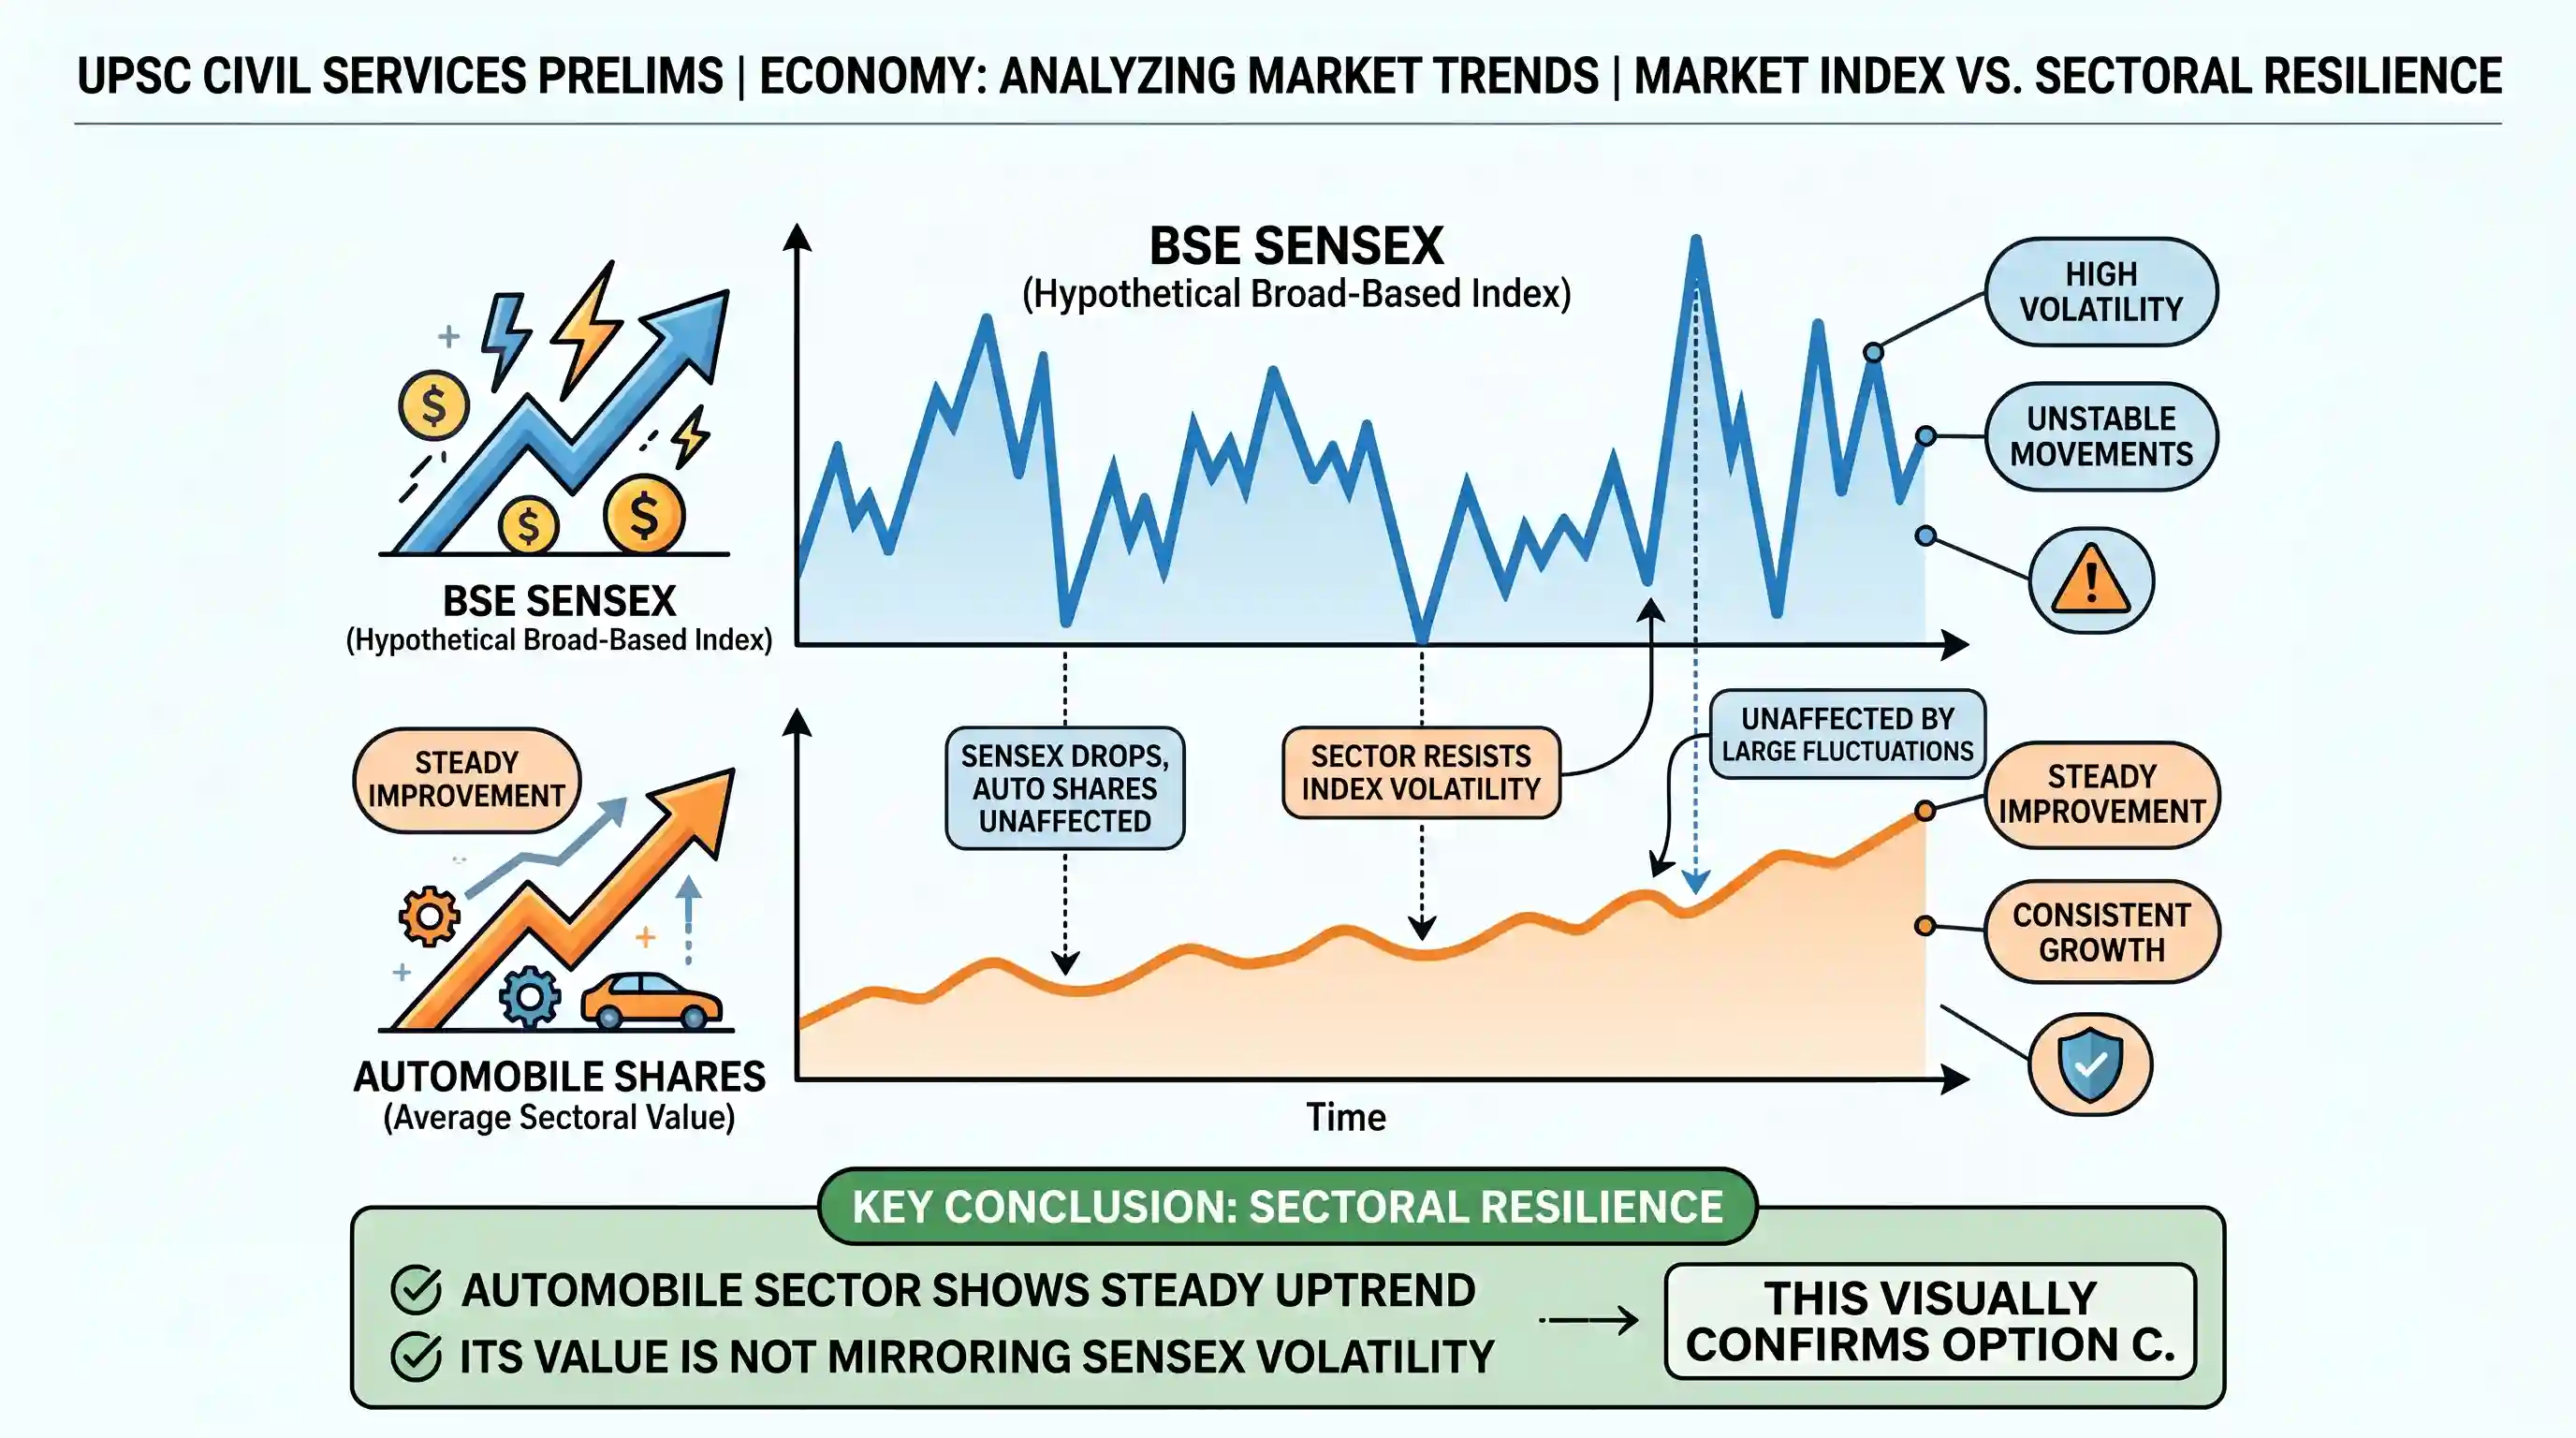
The upper part of the graph is a hypothetical movement in the BSE Sensex over a few months and the lower part is the fluctuation in the average value of automobile shares in the same period (actual values not given). Which one of the following inferences can be drawn from the graphs?
- AThe automobile share market has been as unstable as BSE Sensex in that period
- BThere has been a major political change in June/July
- CAutomobile shares have shown a steady improvement in price, unaffected by large fluctuations in BSE SensexCorrect
- DNone of the above
Explanation
The correct answer is C because of the visual relationship between the two graphs.
The upper graph representing the BSE Sensex shows high volatility with sharp peaks and deep valleys, indicating a very unstable market period. In contrast, the lower graph representing automobile shares shows a consistent and smooth upward trend during the same timeframe.
The automobile line does not mirror the dramatic spikes or drops seen in the Sensex. This indicates that the value of automobile shares remained resilient and continued to improve steadily, even when the broader market index was experiencing extreme fluctuations. Therefore, inference C is the only logical conclusion that can be drawn directly from the visual data provided.
Related questions
More UPSC Prelims practice from the same subject and topic.
- Prelims 2000GS1economy
Match List I with List II and select the correct answer using the codes given below the Lists: I. Development Programme
- Prelims 2000GS1economy
The growth rate of per capita income at current prices is higher than that of per capita income at constant prices, because the latter takes into account the rate of
- Prelims 2000GS1economy
A rise in ‘SENSEX’ means
- Prelims 2000GS1economy
The new Gross Domestic Product (GDP) series released by the Central Statistical Organisation (CSO) in February 1999 is with reference to base price of
- Prelims 2000GS1economy
Match List I with List II and select the correct answer using the codes given below the Lists: List I List II I. Boom A) Business activity at high level with increasing income, output and employment a…
- Prelims 2000GS1economy
That the per capita income in India was Rs. 20 in 1867-68, was ascertained for the first time by