Directions: The following table gives the GDP growth rate and Tele- density data of different States of a country in a particular year. Study the table and answer the two items that follow. States | Per Capita income () | GDP growth rate (%) | Tele-density 1 | 704 | 9.52 | 70.27 2 | 419 | 5.31 | 35.88 3 | 254 | 10.83 | 50.07 4 | 545 | 9.78 | 5.94 5 | 891 | 10.8 | 76.12 6 | 1077 | 11.69 | 77.5 7 | 900 | 8.88 | 104.86 8 | 395 | 5.92 | 6 9 | 720 | 7.76 | 82.25 10 | 893 | 9.55 | 96.7 11 | 363 | 4.7 | 57.7 12 | 966 | 7.85 | 63.8 13 | 495 | 9.37 | 52.3 14 | 864 | 5.46 | 97.9 15 | 497 | 7.48 | 62.3 16 | 777 | 7.03 | 93.8 17 | 335 | 5.8 | 49.9 18 | 599 | 7.49 | 47.84 With reference to the above table, which of the following is/are the most logical and rational inference/inferences that can be made? 1. Higher per capita income is generally associated with higher Tele-density. 2. Higher GDP growth rate always ensures higher per capita income. 3. Higher GDP growth rate does not necessarily ensure higher Tele-density. Select the correct answer using the code given below
- A1 only
- B2 and 3
- C1 and 3Correct
- D3 only
Explanation
Let's analyze each statement:
-
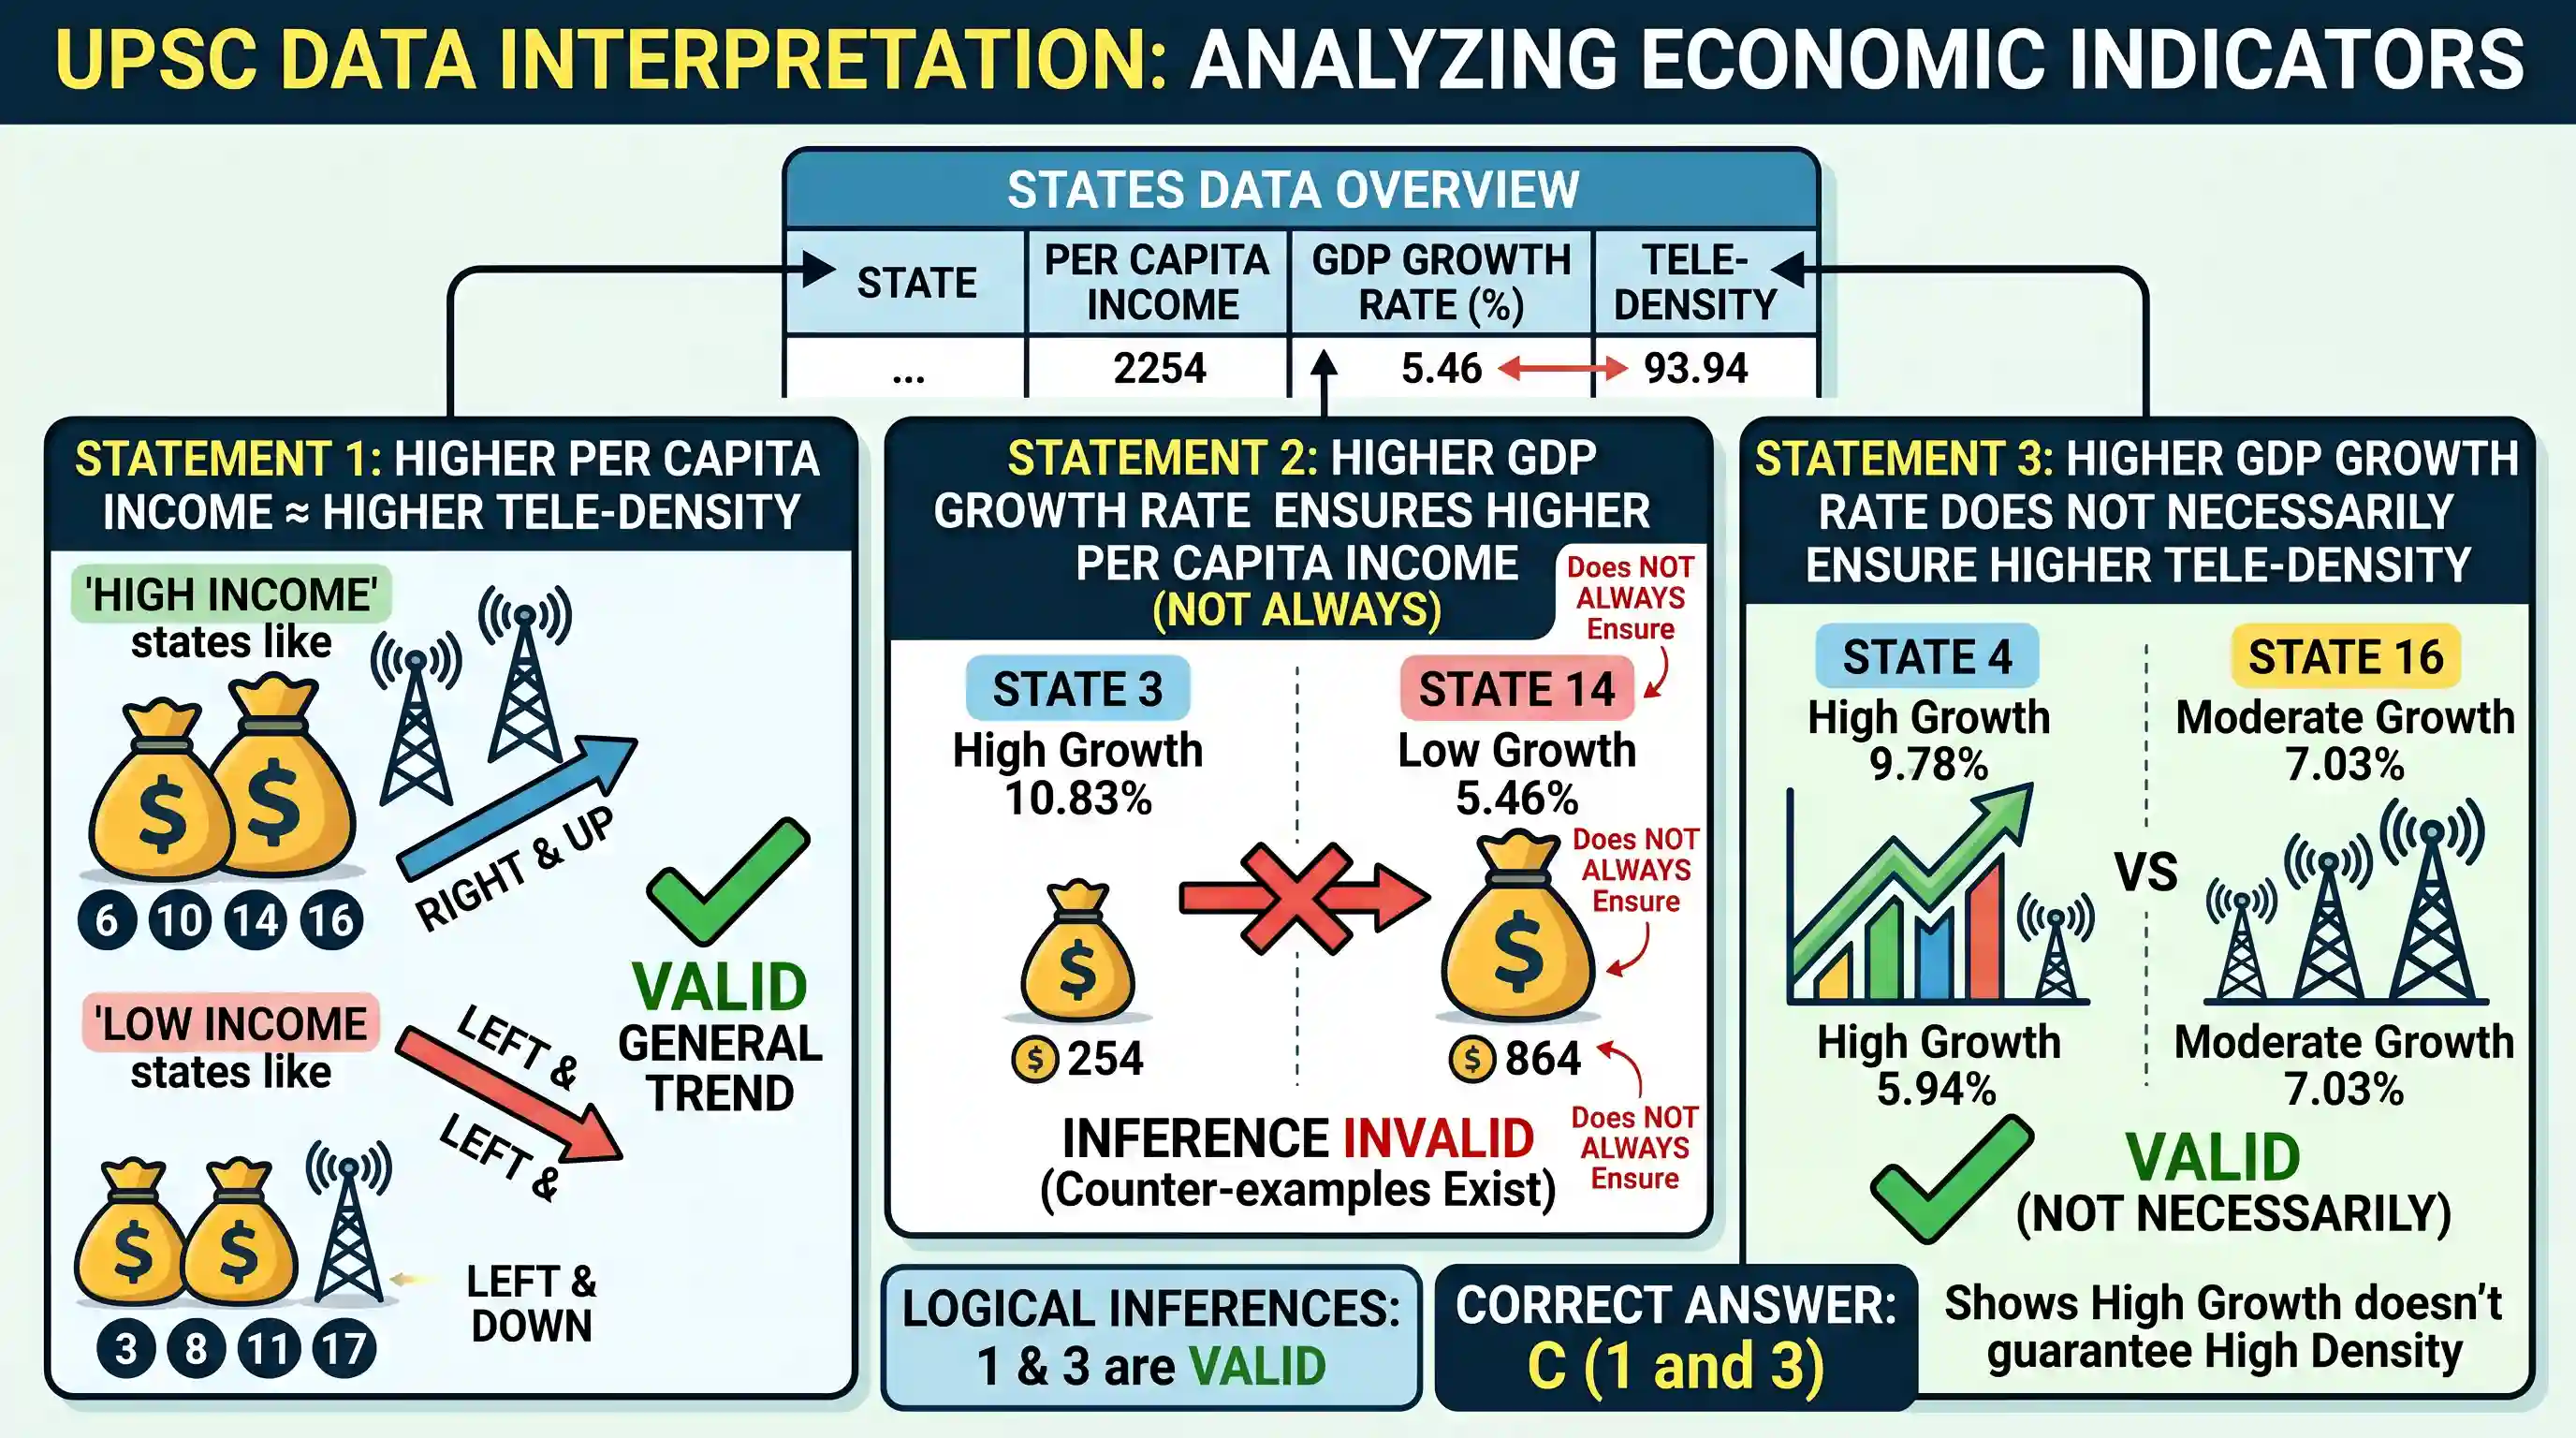
Higher per capita income is generally associated with higher Tele-density. By observing the table, states with higher per capita income (e.g., States 6, 7, 10, 14, 16) generally show higher tele-density figures (e.g., 77.5, 104.86, 96.7, 97.9, 93.8). Conversely, states with lower per capita income (e.g., States 3, 8, 11, 17) tend to have lower tele-density (e.g., 50.07, 6, 57.7, 49.9). While there might be exceptions, the overall trend supports this statement. Thus, this inference is logical.
-
Higher GDP growth rate always ensures higher per capita income. The word "always" makes this a very strong claim. Let's look for a counter-example. State 3 has a very high GDP growth rate of 10.83% but a very low per capita income of 254. In contrast, State 14 has a lower GDP growth rate of 5.46% but a much higher per capita income of 864. This clearly shows that a higher GDP growth rate does not always ensure higher per capita income in a given year, as the starting base and other factors like population growth also play a role. Thus, this inference is not rational.
-
Higher GDP growth rate does not necessarily ensure higher Tele-density. This statement implies that there can be cases of high GDP growth without high tele-density. State 4 has a high GDP growth rate of 9.78% but a very low tele-density of 5.94. State 3 has a high GDP growth rate of 10.83% but a moderate tele-density of 50.07. These examples demonstrate that a high GDP growth rate does not necessarily lead to high tele-density. Tele-density can be influenced by other factors like infrastructure, investment in telecom, and consumer adoption, which may not perfectly align with a single year's GDP growth. Thus, this inference is logical.
Based on the analysis, statements 1 and 3 are logical and rational inferences.
The final answer is C
Related questions
More UPSC Prelims practice from the same subject and topic.
- Prelims 2018CSATQuantitative Aptitude
A bookseller sold 'a' number of Geography textbooks at the rate of Rs. x per book, 'a + 2' number of History textbooks at the rate of Rs. (x + 2) per book and 'a - 2' number of Mathematics textbooks a…
- Prelims 2018CSATQuantitative Aptitude
A student has to get 40% marks to pass in an examination. Suppose he gets 30 marks and fails by 30 marks, then what are the maximum marks in the examination?
- Prelims 2018CSATQuantitative Aptitude
A shopkeeper sells an article at Rs. 40 and gets X% profit. However, when he sells it at Rs. 20, he faces same percentage of loss. What is the original cost of the article?
- Prelims 2018CSATQuantitative Aptitude
A lift has the capacity of 18 adults or 30 children. How many children can board the lift with 12 adults?
- Prelims 2018CSATQuantitative Aptitude
A person bought a refrigerator worth Rs. 22,800 with 12.5% interest compounded yearly. At the end of first year he paid Rs. 8,650 and at the end of second year Rs. 9,125. How much will he have to pay …
- Prelims 2018CSATQuantitative Aptitude
Consider the following sum: • +1• +2• +• 3 + • 1 = 21• In the above sum, • stands for