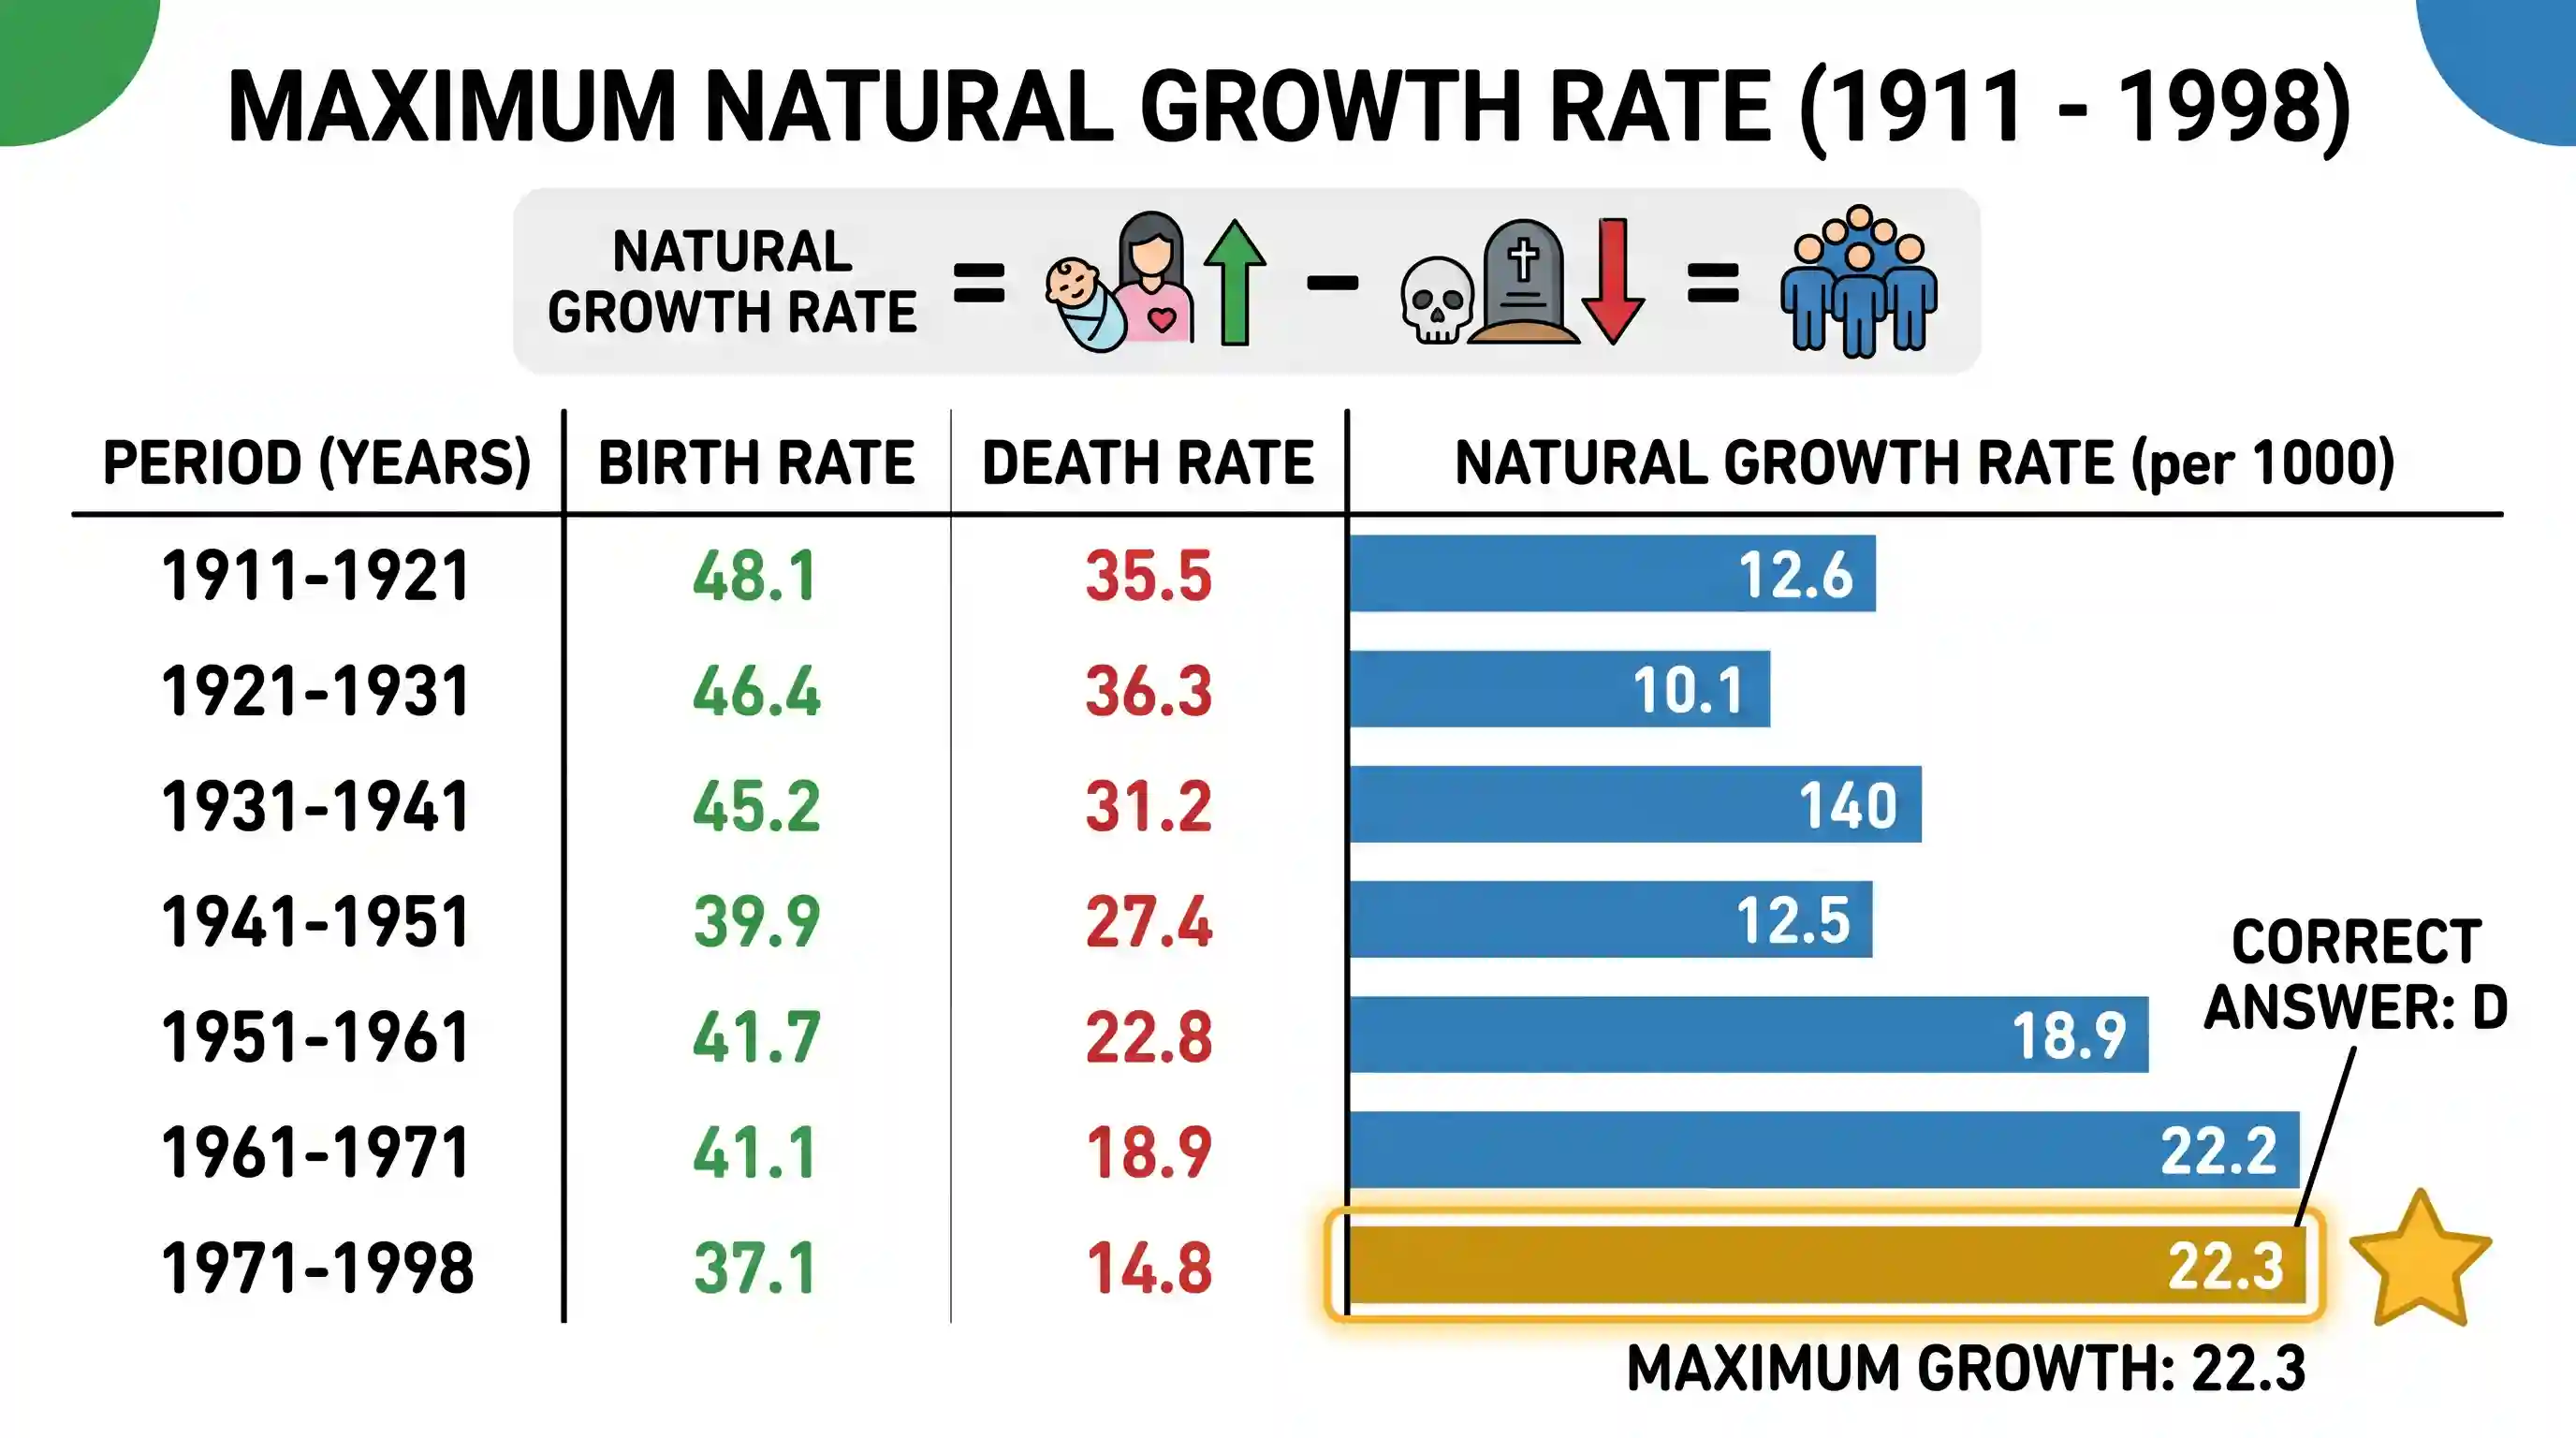
| Year | Birth rate | Death rate | |---|---|---| | 1911 - 1921 | 48.1 | 35.5 | | 1921 - 1931 | 46.4 | 36.3 | | 1931 - 1941 | 45.2 | 31.2 | | 1941 - 1951 | 39.9 | 27.4 | | 1951 - 1961 | 41.7 | 22.8 | | 1961 - 1971 | 41.1 | 18.9 | | 1971 - 1998 | 37.1 | 14.8 | For which period was the natural growth rate maximum?
- A1911 - 1921
- B1941 - 1951
- C1961 - 1971
- D1971 - 1981Correct
Explanation
Natural growth rate = Birth rate - Death rate for each period: 1911-1921: 48.1 - 35.5 = 12.6 1921-1931: 46.4 - 36.3 = 10.1 1931-1941: 45.2 - 31.2 = 14.0 1941-1951: 39.9 - 27.4 = 12.5 1951-1961: 41.7 - 22.8 = 18.9 1961-1971: 41.1 - 18.9 = 22.2 1971-1998: 37.1 - 14.8 = 22.3
The maximum natural growth rate of 22.3 occurred in the 1971-1998 period, which corresponds to option D.
Related questions
More UPSC Prelims practice from the same subject and topic.
- Prelims 2020CSATQuantitative Aptitude
If you have two straight sticks of length 7.5 feet and 3.25 feet, what is the minimum length can you measure?
- Prelims 2020CSATQuantitative Aptitude
Consider the following data: | | Average marks in English | Average marks in Hindi | | Girls | 9 | 8 | | Boys | 8 | 7 | | Overall average marks | 8.8 | X | What is the value of x in the above table?
- Prelims 2020CSATQuantitative Aptitude
The average age of a teacher and three students is 20 years. If all the three students are of same age and the difference between the age of the teacher and each student is 20 years, then what is the …
- Prelims 2020CSATQuantitative Aptitude
A person bought a car and sold it for Rs. 3, 00,000. If he incurred a loss of 20%, then how much did he spend to buy the car?
- Prelims 2020CSATQuantitative Aptitude
A shop owner offers the following discount options on an article to a customer: Successive discounts or 10% and 20% , and then pay a service tax of 10% Successive discounts of 20% and 10% , and then p…
- Prelims 2020CSATQuantitative Aptitude
What is the largest number among the following?