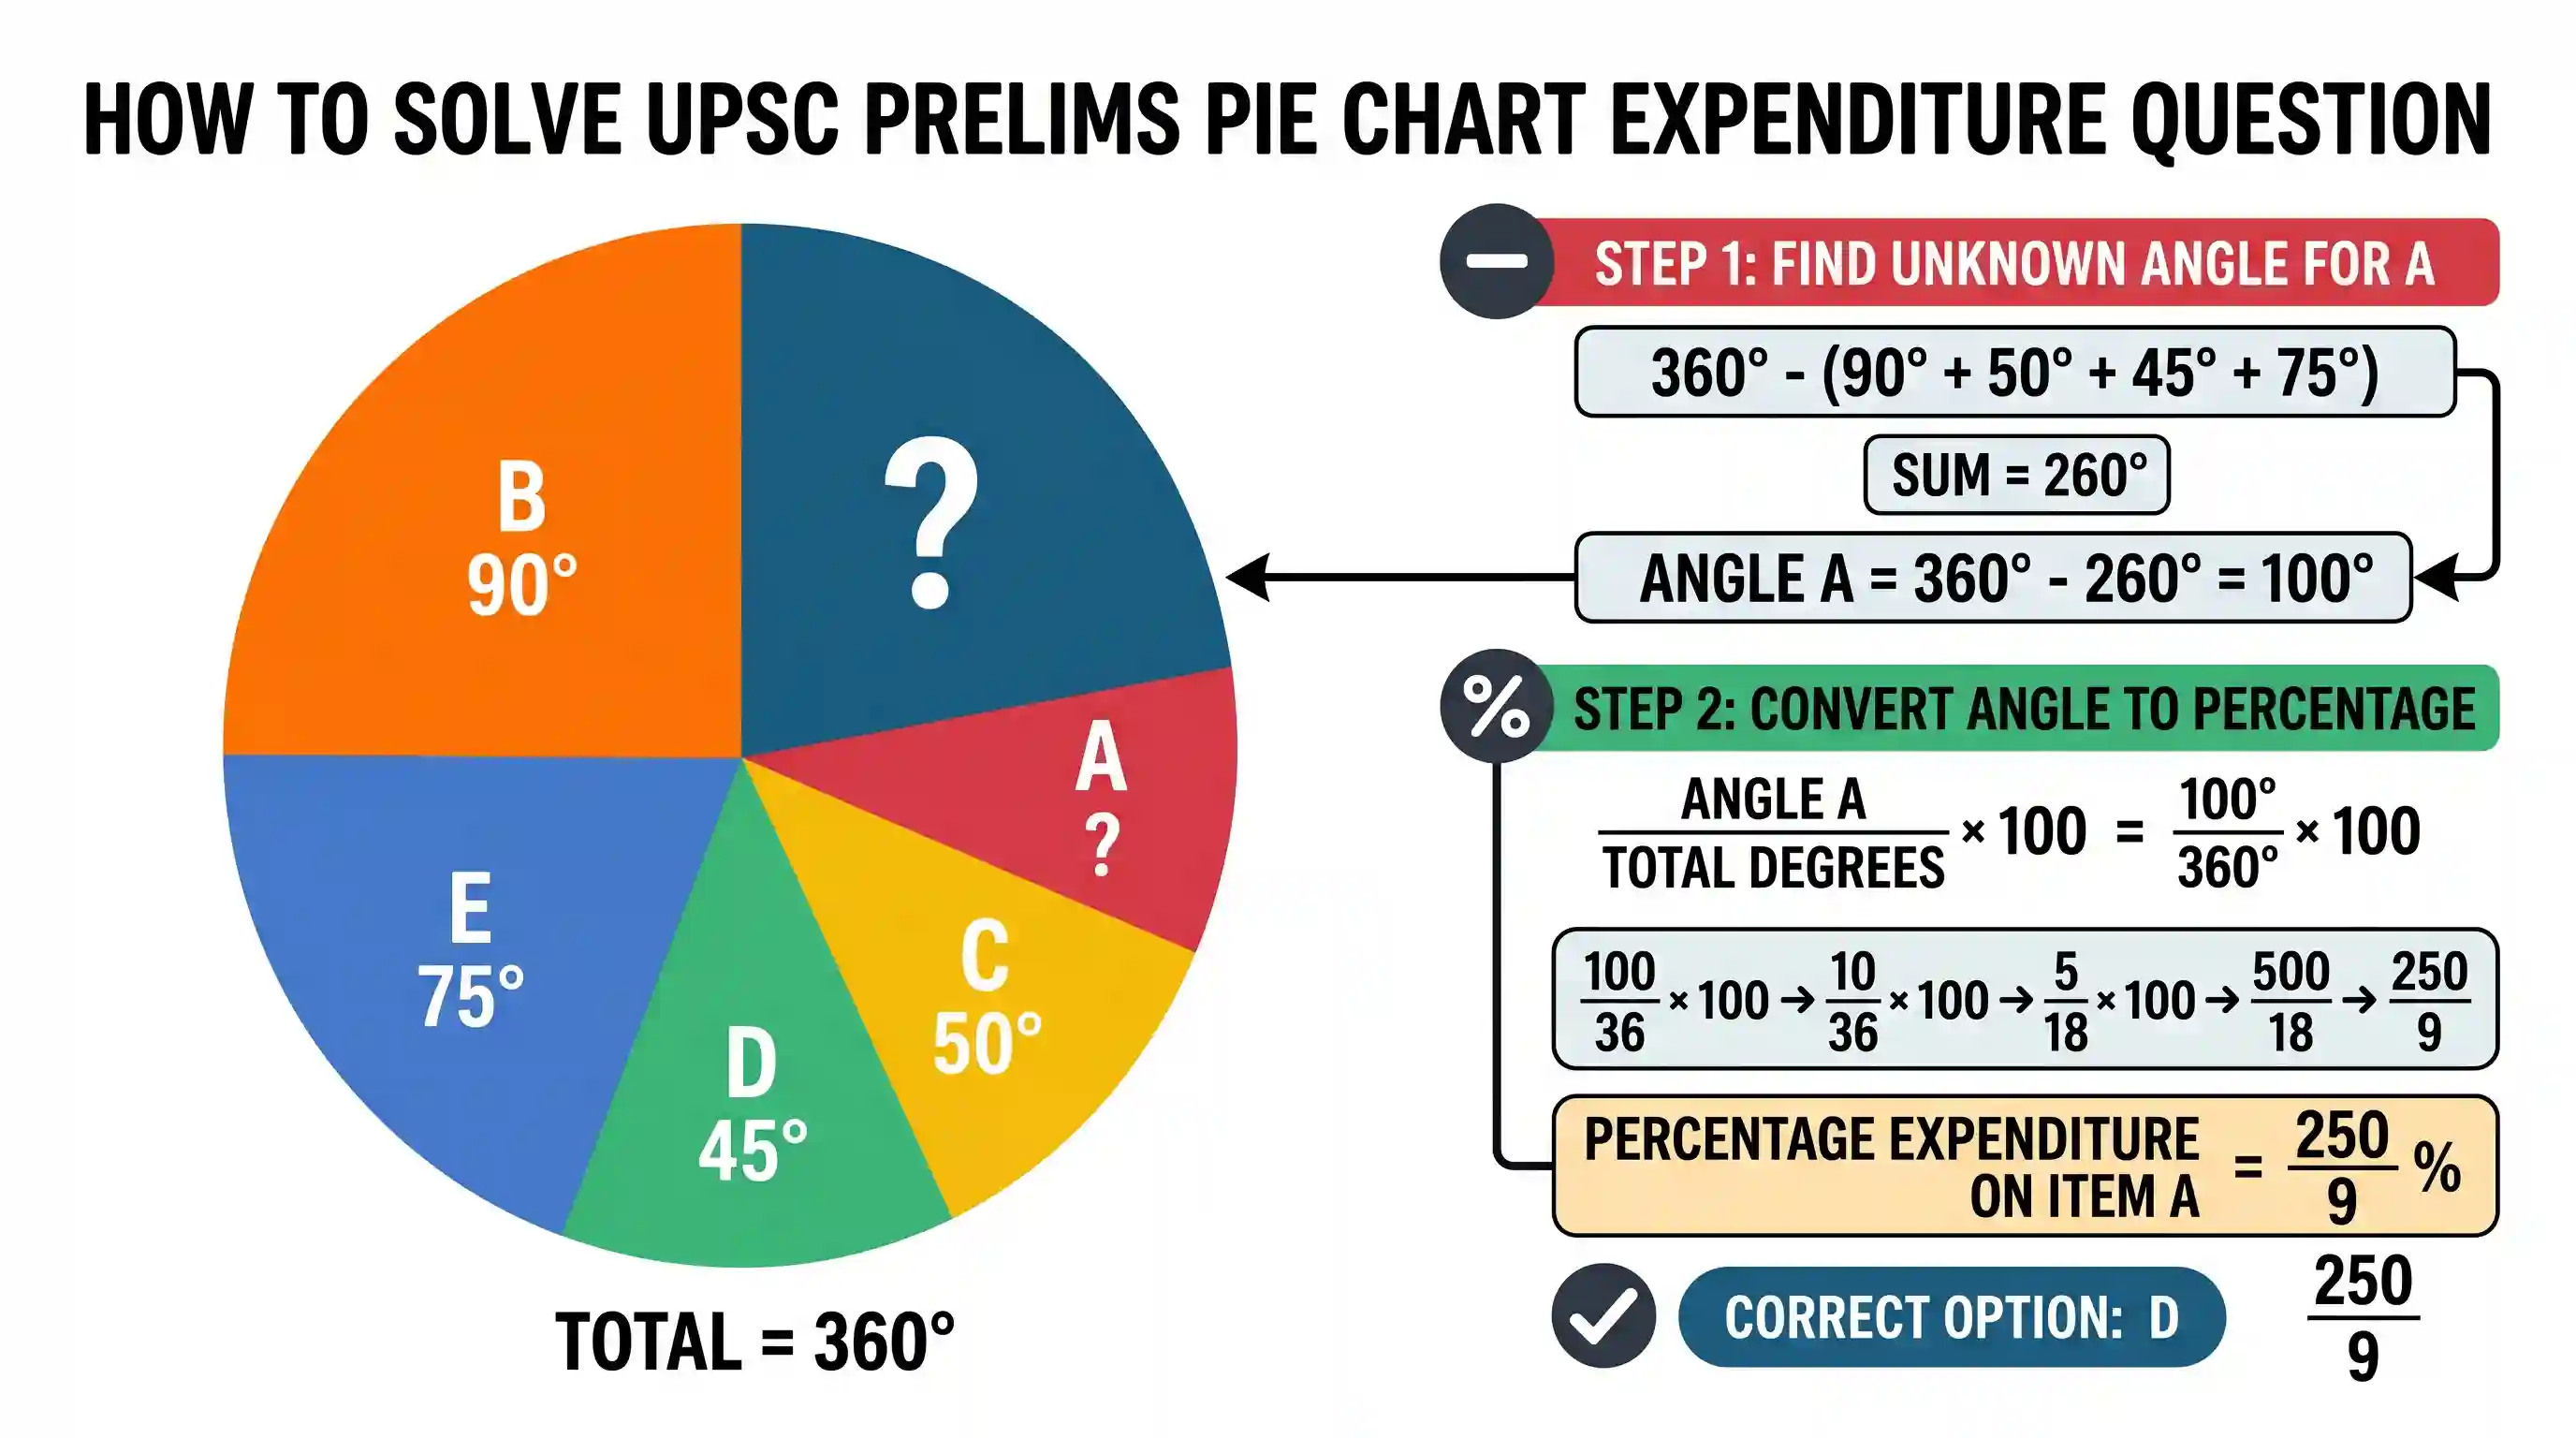
A pie chart gives the expenditure on five different items A, B, C, D and Ein a household. If B, C, D and E correspond to 90° , 50° , 45° and 75° respectively, then what is the percentage of expenditure on item A?
- A(112)/(9)
- B(125)/(6)
- C(155)/(9)
- D(250)/(9)Correct
Explanation
A pie chart represents a full circle, which is 360 degrees. The sum of degrees for items B, C, D, and E is 90 + 50 + 45 + 75 = 260 degrees. To find the degrees corresponding to item A, subtract the sum of the other items from the total 360 degrees: Degrees for A = 360 - 260 = 100 degrees.
To convert this into a percentage of expenditure, divide the degrees for A by the total degrees (360) and multiply by 100: Percentage of A = (100 / 360) * 100 Percentage of A = (10 / 36) * 100 Percentage of A = (5 / 18) * 100 Percentage of A = 500 / 18 Percentage of A = 250 / 9
Therefore, the percentage of expenditure on item A is 250/9.
Analyzing the options: A) (112)/(9) is incorrect. B) (125)/(6) is incorrect. C) (155)/(9) is incorrect. D) (250)/(9) matches our calculated value.
The final answer is D.
Related questions
More UPSC Prelims practice from the same subject and topic.
- Prelims 2022CSATQuantitative Aptitude
A bill for ₹1,840 is paid in the denominations of ₹50, ₹20 and ₹10 notes. 50 notes in all are used. Consider the following statements: 1. 25 notes of ₹50 are used and the remaining are in the denomina…
- Prelims 2022CSATQuantitative Aptitude
In a tournament of Chess having 150 entrants, a player is eliminated whenever he loses a match. It is given that no match results in a tie/draw. How many matches are played in the entire tournament?
- Prelims 2022CSATQuantitative Aptitude
The increase in the price of a certain item was 25% . Then the price was decreased by 20% and then again increased by 10% . What is the resultant increase in the price?
- Prelims 2022CSATQuantitative Aptitude
On one side of a 1.01 km long road, 101 plants are planted at equal distance from each other. What is the total distance between 5 consecutive plants?
- Prelims 2022CSATQuantitative Aptitude
Consider the Question and two Statements given below in respect of three cities P , Q and R in a State: Question: How far is city P from city Q ? Statement - 1: City Q is 18 km from city R . Statement…
- Prelims 2022CSATQuantitative Aptitude
Five friends P , Q , X , Y and Z purchased some notebooks. The relevant information is given below: 1. Z Purchased 8 notebooks more than X did. 2. P and Q Together purchased 21 notebooks. 3. Q purchas…